DMA sensor chart
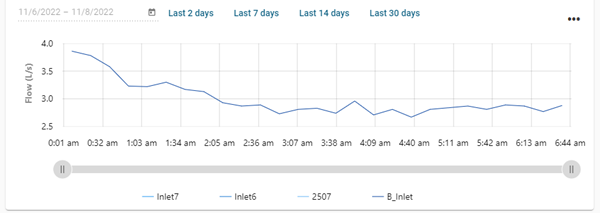
On the Operational Visibility DMA sensors page, the chart panel (beneath the DMA sensor map) displays graphed data from all DMA sensors that are selected on the map.
Note: Missing data is displayed on the chart as a dotted line. Forecast data is displayed as a dashed line.
The chart supports the following controls:
-
To add sensor data to the chart, click one or more sensor icons on the map. Selected sensor icons appear larger. Click any selected sensor icons again to deselect the sensors and remove their data from the chart. For more information, see DMA sensor map.
-
By default, data from the current day is shown. To change the timeline represented on the x-axis, click an option above the chart: Last 2 days, Last 7 days, Last 14 days, or Last 30 days. For a custom range, click the calendar icon (
 ) and select a date range from the calendar:
-
Click the beginning date on the calendar. Use the arrow icons to scroll to the desired month.
-
Click the end date on the calendar. The selected dates appear highlighted in blue.
-
Click Apply. The data displayed in the chart updates accordingly.
-
-
Hover over a point in the chart to reveal tooltips for each sensor with the sensor name and data value.
|
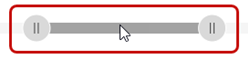
Tip: For a more detailed view of the data, drag the left and right ends of the slider beneath the graph to define the zoom range, and then drag the entire slider left or right to adjust the view.
The x-axis and data shown on the graph automatically scale to reflect the defined range. To restore the graph to its original view, click the Zoom out icon ( |
 ).
).The unit of measurement represented on the y-axis varies according to the sensor type:
-
Pressure sensors measure units of liquid level, such as meters of water column (mH20).
-
Flow sensors measure units of volumetric flow, such as liters per second (L/s).
-
Water level sensors measure units of distance, such as meters (m).
To export the data represented in the DMA sensor chart, take the following steps:
-
Click the Actions menu icon (
 ) and select Export. A dialog appears.
 -
From the Format dropdown, select Image or Data.
-
From the File type dropdown, select one of the following options:
-
Image format: Select JPG or PNG.
-
Data format: Select CSV.
-
-
Click Export. The file saves to your browser's configured download location.